


S&P 500 Index
- By date
- Metadoro first
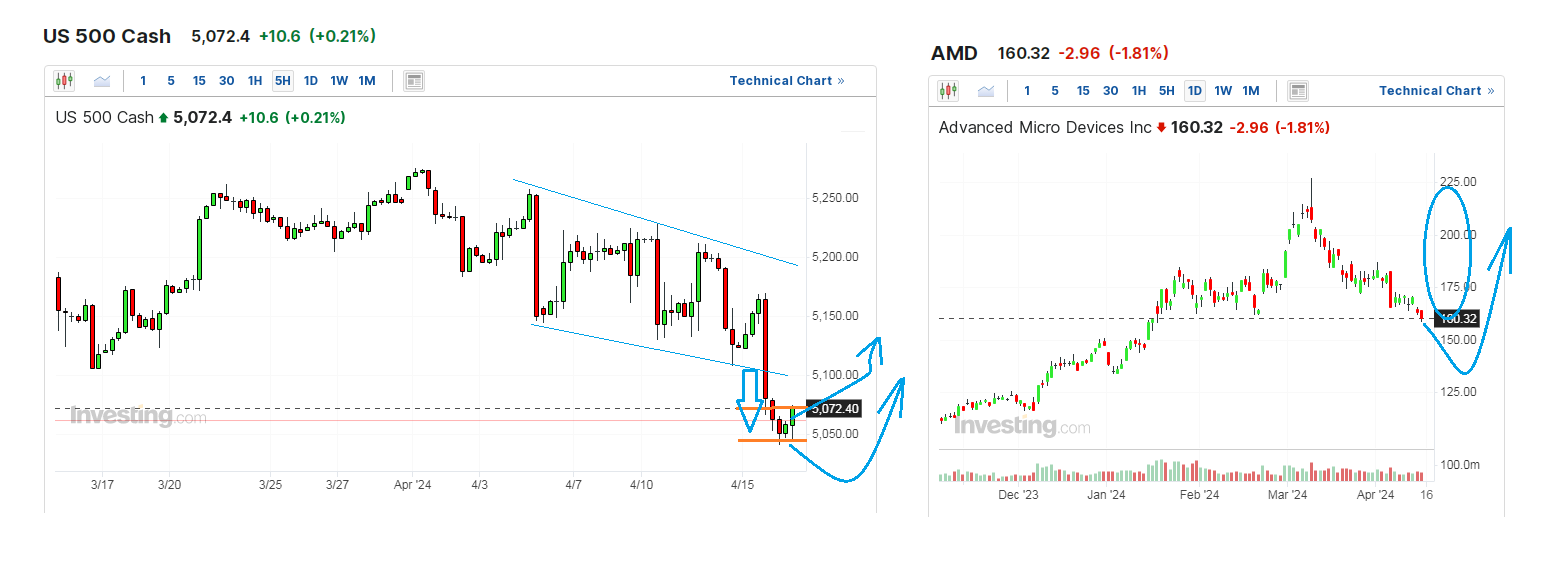
I don't think the recent S&P 500 retracement to a 5,050-5,075 area is threatening the stock rally. This short correction began last Friday only because of the clear drawdown in the US banking segment. I expected the trash scenario for the flagship banking stocks when I sold off my last remaining stocks of JPMorgan (JPM) just a day before the bearish signs were included into its weaker forward guidance as an attachment to a regular and strong quarterly report. I am not going to repeat all of my arguments behind the situation. Anyway, when other sectors of the market are mostly stable or unmoved, the downward momentum by several leading banks define the overall bearish mood for the broad indexes. Meanwhile, the fundamentals of the rally, especially in the AI and e-commerce segments, still look as strong as it was a couple of weeks ago and in recent months as well. Therefore, I feel comfortable to invest some free cash into temporarily discounted chip producers like AMD, or into the GPT chats based giants, including Microsoft and Google. I have no doubts in a step-by-step recovery of AMD from its current $160 per share to above $200 once again to cover a nearly 30% discount from its peaking price, even though high bond yields behind a drop in banking stocks, Middle East developments to some extent, may bring the S&P 500 to 5,000 or even a little bit lower when going with the flow. All this temporary agenda is hardly to change the basic instincts of large investment houses that avoid money and want more shares in growing businesses.
S&P 500 Index
As it is the most commonly used stock index it has some unique features a trader should keep in mind:
- The index represents the broad stock market performance since it lists companies from various sectors. It is not focused on specific industries or segments like the Dow Jones index family and the Nasdaq index. So, it is often called a “barometer of American economy;
- There are different sectors inside the index, which represent companies from familiar and particular sectors. According to numbers released on May 31, 2023 the smallest sector by market cap is Materials with a share of 2.4% (all numbers are given as of May 31, 2023), while the largest is Information technology with 28% of the index market cap. The index also lists companies from healthcare, financials, consumer discretionary, communication services, industrials, consumer staples, energy, utilities, and real estate. A sector breakdown allows investors to distinguish the best performing sectors and select the best performing stocks inside the sector. It also allows for the evaluation of economic performance of the United States in General and for a look at what is driving the American economy;
- The index is very sensitive to macroeconomic data, and positively reacts to rising GDP, retail sales, investments, and the phase in which houses are being built. Any negative news in these areas may push the index down. Macroeconomic data may have a sustainable effect on the index as declining GDP will put sustainable pressure on it, and vice versa;
- The index is very sensitive to the monetary policy decisions of the Federal Reserve (Fed). Rising interest rates and increasing borrowing costs result in less money in the economy and this leads to lower corporate margins, lower consumer and investment demand, and eventually to lower investments in stocks. So, the Fed’s hawkish stance usually results in a weaker S&P 500 index. A dovish monetary policy by the Fed usually supports the index. Thus, the Fed’s interest rate actions, testimonies of its head and FOMC voting members should be monitored;
- The Consumer Price Index (PCI) and the Personal Consumption Expenditures Price Index (PCE) data, which represent inflation, affect the index. If the numbers are far from the Fed’s target, which is set at 2%, it may signal to the possibility that the Fed may continue with its hawkish stance, meaning pressure on the S&P 500 index. Any increase of inflation means the pressure will rise. If inflation slows down to below the 2% target, it is likely to push the index up;
- The S&P 500 index is a risky asset as it represents the sentiment in the market, and the appetite for risk. A rising appetite for risk supports the index, while uncertainty, which lowers economy and geopolitical risks, put pressure on it;
- The index has a negative correlation with the USD/JPY as the Japanese Yen is regularly used for carry trading. So, a deteriorating Yen may signal to a decline of the index;
- The S&P 500 is a very popular asset for investments. An individual may invest in S&P futures, CFD’s of ETF’s that are linked to the index. This is a very diversified asset, and is suitable for conservative investors as it has lower volatility than any of its components, or even currencies or commodities. Thus, the index may serve as a hedge asset inside an investment portfolio;
- The index is linked to the U.S. stock market’s opening hours, but futures and CFD trading on the index continues mostly throughout 24/5, excluding weekends. So, the index may open with a gap if something very important has happened during a weekend.
| Ticker | US500 |
| Contract value | 10 USD x US500 Index |
| Maximum leverage | 1:100 |
| Date | Short Swap (%) | Long Swap (%) | No data |
|---|
| Minimum transaction volume | 0.01 lot |
| Maximum transaction volume | 100 lots |
| Hedging margin | 50% |
| USD Exposure | Max Leverage Applied | Floating Margin |
|---|