UK Brent Crude Oil
- By date
- Metadoro first
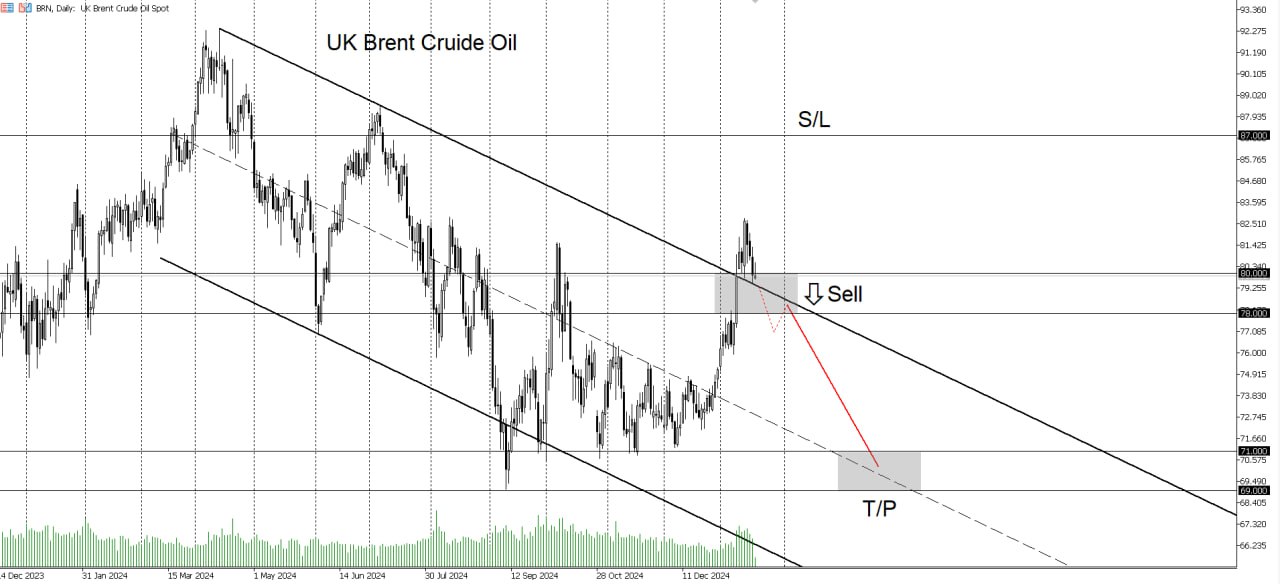
Brent crude prices are unlikely to sustain levels above the key resistance at $78.00-80.00 per barrel. Following a 10.0% rally to $82.78 in the first half of January, driven by new U.S. sanctions targeting Russia’s oil sector, the market now appears primed for a pullback.
Prices have returned to the trend resistance zone at $79.50-80.00 per barrel. Should the pullback persist, Brent crude may re-enter a downtrend, effectively closing the door to further upside opportunities if it drops below $78.00. While there are still prospects for upward movement, current conditions make short trades particularly risky at this stage.
However, if prices consistently remain below the $78.00-80.00 resistance level, I plan to initiate a short trade, targeting an ambitious downside range of $69.00-71.00 per barrel. This trade will be set up following a retest of the resistance zone, with a stop-loss placed at $87.00 per barrel to safeguard against excessive market volatility.

UK Brent Crude Oil
BRN is traded on the Intercontinental Exchange (ICE). Crude is a standartised exchange asset and is primarily traded on the commodity exchange. This commodity has very distinctive features:
- Prices of crude are largely affected by the demand that is driven by the economic situation on a global scale. A booming economy usually means more fuel consumption that pushes up crude prices. A slowdown of the economy, or a recession, usually means a decline of crude prices. The demand and supply of oil, along with forecasts, are regularly released by prominent international organisations, like the Organisation of Petroleum Exporting Countries (OPEC), the International Energy Agency (IEA), and the U.S. Energy Information Administration (EIA);
- Prices are especially vulnerable to economic situations in the United States and China, which are the major consumers of oil. Thus, GDP, retail sales, industrial output, business activity indicators, unemployment, inflation, etc. in these countries affect crude prices and should be monitored carefully;
- Monetary policies of the U.S. Federal Reserve (Fed) and other major central banks also affect crude prices. Dovish monetary policies, especially by the Fed, foster economic expansion, increase the demand for oil and support prices. Higher interest rates suppress economic activity and limit the demand for oil;
- Crude oil is a risky asset. Thus, positive sentiment in the market, a rising appetite for risk, and rising stock indexes support crude prices. The CBOE Volatility Index (VIX) could serve as an indication of risk tolerance. The higher the index, the more pressure crude prices are facing. Alternatively, a lower index supports crude prices;
- The U.S. Dollar exchange rate directly affects crude prices as commodity prices are measured in Dollars. Moreover, the U.S. Dollar is a safe haven asset and its strengthening is also associated with rising risks, meaning that crude prices are under pressure as a risky asset. The U.S. Dollar Index (DXY) may serve as an indication of this criteria;
- From the supply side crude output level, changes of crude oil inventories and supply disruptions affect prices. For example, crude oil inventories in the United States, the data that is usually released every Wednesday by the EIA, may have an immediate short-term effect on prices, while agreements in crude production quotas of OPEC have more long-term effects on prices;
- Geopolitical tensions heavily affect crude prices. However, rising political tensions may push crude prices up. Which is quite different compared to other commodities. Rising political tension on oil-producing countries may have a strong impact on prices. Military tension in the Persian Gulf area, where vast oil production is located, may disrupt oil production and its transportation, which will result in rising crude prices;
- Oil price changes affect stock prices of oil production companies, gas prices as an alternative fuel, and other fuels. Lower or higher crude prices affect commodity-driven currencies like the Canadian Dollar (CAD), the Norwegian Krone (NOK), the Mexican Peso (MXN) and the currencies of other oil-producer nations.
| Ticker | BRN |
| Contract value | 1000 |
| Maximum leverage | 1:100 |
| Date | Short Swap (%) | Long Swap (%) | No data |
|---|
| Minimum transaction volume | 0.01 lot |
| Maximum transaction volume | 100 lots |
| Hedging margin | 50% |
| USD Exposure | Max Leverage Applied | Floating Margin |
|---|


