News and analysis
The very first slice of statistical data on business activity from the United States this year reaffirmed an almost clear irrelevance and even potential hurtfulness of any immediate steps towards further lowering interest rates on U.S. Dollar-nominated loans from a purely economic point of view. The ISM Manufacturing PMI (Purchasing Managers Index), based on polls compiled from executives in over 400 industrial companies in late December, came out at 49.3 points vs 48.4 a month ago and 48.2 in average analyst estimates. This showed that a slowdown was occurring at a slower or even insignificant pace, keeping inflation risks on the table, especially when the price component increased from 50.3 to 52.5 with a similar rate of increase in new orders. Meanwhile, non-manufacturing PMI came out at 54.1 on Tuesday, compared to 53.5 in analyst polls and 52.1 a month ago, with a contribution of business activity components even jumped to a surprising 58.2 against declining from 57.2 in November to only 53.7 in December.
In other words, the economy is not cooling, and is rather in a positive acceleration, which in turn may lead to a recovery in wage rises and therefore to higher demand pressure, which may be reflected soon in higher producer purchase and output prices. Doubts of the major U.S. financial regulator are understandable at this point after its triple rate cut from 5.5% to 4.5% in 2024. The Federal Reserve (Fed) will now pay closer attention not only to consumer inflation measures, but also to producer prices (PPI), which is just going to be released on coming Tuesday, January 14. And so, this will become the next reference point in the further U.S. Dollar’s trajectory. The Greenback index (DX) is picking up steam since reaching a new record high for the last two years at 109.35, with its temporary pullbacks being limited by a 107.50 support area that previously served as a strong multi-month technical resistance.
In this context, the British Pound (GBPUSD) updated its lows since November 2023 to touch 1.2237 on January 9, EURUSD feels quite comfortable within a range between 1.02 and 1.0450, which corresponds to its 2-year bottom, and having a bias towards a possible further decline. The Aussie (AUDUSD) is one-step away from taking the path for a breakthrough to a quite unknown territory of its 5-year lows that were last time recorded when the initial outbreak of the Covid-19 happened.
A varying extent of the American Dollar strength is surely data dependent as the market community is eagerly waiting for the U.S. job data later today. The average expectations on new Nonfarm Payrolls is just a bit above 150,000 vs 227,000 in early December 2024 and nearly 160,000 for the previous four months on average. However, any value close to 150,000, plus or minus 20,000, or any higher number, may be considered as another positive sign for the Greenback, following the ADP national employment report which contained only 122,000 on Wednesday. The oppressive nature of average hourly wage in its dynamics, +0.4% each time from September to December, also matters.
The protective quality of investing more funds into the U.S. Dollar and U.S. bonds against tariff threats is switched on anyway, based on more than a 95% chance for the Fed to keep rates on pause at its January 29 meeting, according to CME's FedWatch tool. Federal Reserve officials never go against a well-established market consensus, when it is almost unanimous, for not to rock the boat of relative market trend stability. The central bankers' reluctance to shift the Fed fund rates lower before mid-March, if not early May, continues to play in favour of short-term speculative transactions on the foreign exchange market, bearing in mind all the listed currency instruments. Some intraday volatility may take place, especially in the case of appearing an abnormal two-digit non-farm value, but not a change in overall direction.
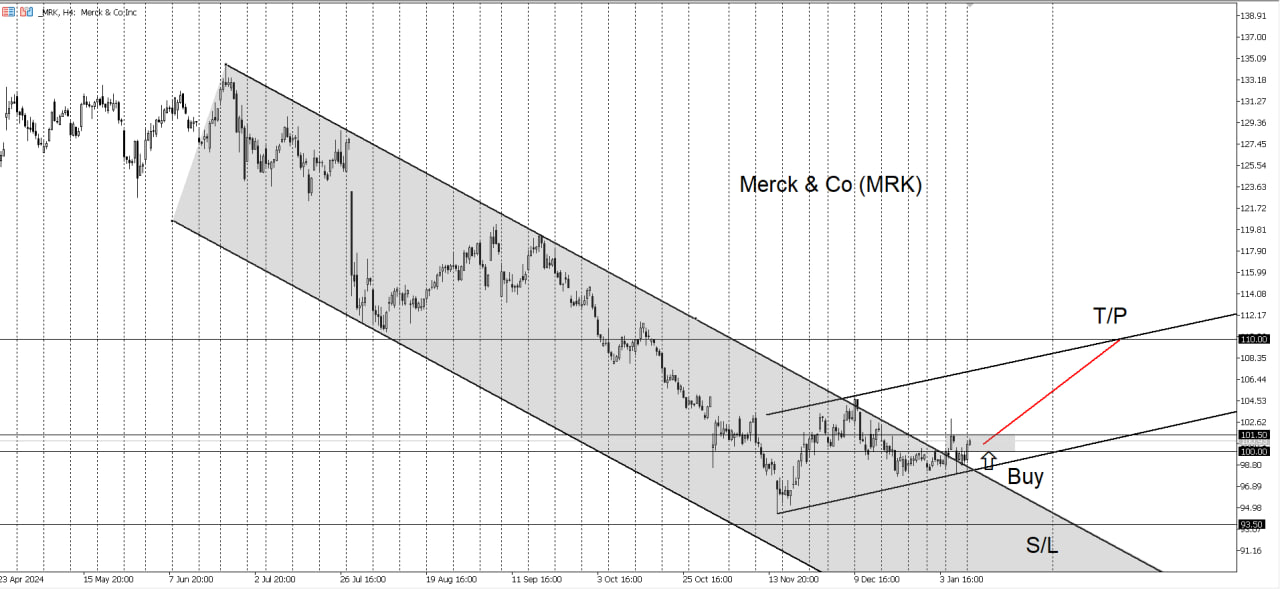
Merck & Co (MRK) stocks have shown signs of becoming a compelling buy opportunity. Over the past six months, the stock has been in a downtrend, declining 29.8% to $94.50 per share. However, since mid-November, MRK has demonstrated a reversal of momentum, rebounding by 10.0% to reach $104.87 on December 5. Following a brief pullback and consolidation period, the stock has retested the downtrend resistance and appears poised to continue its upward trajectory.
With prices currently positioned to target $110.00, this represents a potential 9-10% upside from the present levels. Setting a stop-loss at $93.50 aligns with a prudent risk management strategy, providing protection against further downside while allowing for upside potential. The recent consolidation phase further supports the case for a breakout, making this an attractive moment to consider initiating or adding to a position in MRK.
Here is the problem, which is nearly at a primary school level. A simple logical puzzle. A shopping street has two grocery stores. One of the stores is much more popular than the other. But both shops are full of customers every day. So both shops are raking in money. Sales output of a more popular store roughly doubled over the past year, from $14.5 billion to $30.8 billion - oh, yes, it's a very big shop - which led to tripling of its market value. Meanwhile, sales in the second store have already grown by 69%, albeit by its lower standards, namely from $2.3 billion to $3.9 billion. Please draw a conclusion, by what percentage the market value of the second store could increase, assuming that professional appraisers are rather objective. It seems ridiculous, but the correct answer is that the second store's market value lost 35% within the same year, and it even dropped by 50% from its peak price of the last spring. Holy Cow! That was a story of some failed expectations of mine. Since the big store is, of course, Nvidia, and the small one (and also, in fact, quite a prosperous marketplace) is Advanced Micro Devices (AMD). And their goods are not essential food, but chips for artificial intelligence (AI) related data centers, which are also in high demand.
Moreover, AMD shares reportedly tumbled 10% additionally on February 5, only because the firm's AI chip revenue failed to be exactly in line with elevated projections of Wall Street analyst pool, which somehow bet on a 80% pace of data centre growth to as much as $4.15 billion YoY. Okay, one might say that Nvidia's "store" sells 8 times more chips that everyone needs. And even remember that Nvidia chips are of better quality, that Nvidia occupies about 80% of global chip market share. Again, Nvidia's last quarter will be finally counted only by February 26, when Nvidia's financial report is scheduled, a month later than in AMD's case. Like most large investment houses, here I have provided growth metrics regarding the major data center segment, which is a proxy for the AI playground, where AMD struggles to compete with Nvidia. Well, AMD CEO Lisa Su admitted that her company's data center sales in the current quarter may go down about 7% from the just-ended quarter, but this announcement was exactly in line with an overall expected decline. Is it really such a big deal that AMD shareholders have to experience pain from seeing their chosen stock falling to a 14-month low, with further need for a 100% rally just to match last year's record prices?
The same Lisa Su declined to give the particular forecast for the company's AI chips, but she said that AMD expects "tens of billions" of dollars in sales "in the next couple of years". And I see no reason to doubt her words. AMD CEO added that the firm is now working to compete against Broadcom (AVGO) in collaborating with its customers like Meta and Microsoft to create custom AI chips for their purposes, as Broadcom helps its partners to design their own chips, contrary to mostly "off-the-shelf" processors by AMD and Nvidia. They know their weaknesses as opportunities for strengthening to work in that direction, so what's wrong with the market's adequacy of perception? Perfect Nvidia is the enemy of good AMD, according to the crowd's opinion. Besides AI chips, AMD is also one of the largest providers of personal computer chips. Until recently, this point was generally the source of their main income. Consumers continue to buy new PCs, which also can handle generative AI tasks, by the way.
Actually, AMD has been the only loss-making company in my large portfolio for a long time, so it even makes me smile now. At least, because it is only a matter of time before AMD's pogo stick ultimately uncoils to come loose. Record annual revenue and earnings have to entail recovering to record market value eventually. I am not sure this will happen in the first half of 2025, even though AMD forecasts its revenue rise between $6.8 billion and $7.4 billion for the current quarter, with the market consensus midpoint being slightly lower at $7.04 billion. If you don't believe me then analysts at Stifel are of the opinion that AMD is well positioned for AI compute and "It is likely" that some of its customers "are waiting for 325/350 systems, which should drive a much stronger second half". Again, the median estimate by the Wall Street's analyst pool was now declined to about $150 per share vs $166.5 before the last downside move, yet even $150 sounds much better compared to $112 on closing price this Wednesday or an intraday low at $106.56 during the last trading session. Anyway, there is a strong technical and psychological support zone near the round figure of $100, from where AMD stock had begun its cool ascension in late 2023.
VeChain (VET) has fallen 12.7% this week, trading at $0.0445, underperforming the broader cryptocurrency market. Bitcoin (BTC), the leading cryptocurrency, has declined by 5.6% to $93,220, with bearish momentum building as it approaches key support at $89,000-$91,000. This decline is largely attributed to tightening monetary conditions in the United States, which continue to weigh on risk assets. Investor confidence is further shaken by significant net outflows from spot BTC-ETFs, which lost $583 million on Wednesday, marking the second-largest single-day outflow on record.
If BTC falls below the critical support level of $89,000-$91,000, VeChain is likely to extend its losses, with prices potentially declining another 10% to $0.0400. A sustained drop in BTC could push VET even lower, towards $0.0300. Conversely, a strong rebound in BTC prices to the $100,000 level could drive VET back up to $0.0500, representing a recovery of approximately 12% from current levels.
Tezos (XTZ) has declined slightly by 0.2% this week, trading at $1.249, following Bitcoin’s (BTC) drop to $89,158, which triggered widespread altcoin sell-offs due to concerns of a potential further decline in BTC to $80,000. However, Bitcoin managed to hold above the critical support level at $89,000-$91,000, offering some relief to the broader crypto market.
Speculation about a shift in U.S. trade policy has provided additional support to crypto assets. Reports suggest the new U.S. administration may pursue a gradual increase in tariffs rather than an abrupt hike, which could help alleviate inflationary pressures and lead to a less aggressive monetary stance from the Federal Reserve.
This development is a positive signal for the cryptocurrency market and may help Tezos maintain its position above the key support level of $1.200.
The very first slice of statistical data on business activity from the United States this year reaffirmed an almost clear irrelevance and even potential hurtfulness of any immediate steps towards further lowering interest rates on U.S. Dollar-nominated loans from a purely economic point of view. The ISM Manufacturing PMI (Purchasing Managers Index), based on polls compiled from executives in over 400 industrial companies in late December, came out at 49.3 points vs 48.4 a month ago and 48.2 in average analyst estimates. This showed that a slowdown was occurring at a slower or even insignificant pace, keeping inflation risks on the table, especially when the price component increased from 50.3 to 52.5 with a similar rate of increase in new orders. Meanwhile, non-manufacturing PMI came out at 54.1 on Tuesday, compared to 53.5 in analyst polls and 52.1 a month ago, with a contribution of business activity components even jumped to a surprising 58.2 against declining from 57.2 in November to only 53.7 in December.
In other words, the economy is not cooling, and is rather in a positive acceleration, which in turn may lead to a recovery in wage rises and therefore to higher demand pressure, which may be reflected soon in higher producer purchase and output prices. Doubts of the major U.S. financial regulator are understandable at this point after its triple rate cut from 5.5% to 4.5% in 2024. The Federal Reserve (Fed) will now pay closer attention not only to consumer inflation measures, but also to producer prices (PPI), which is just going to be released on coming Tuesday, January 14. And so, this will become the next reference point in the further U.S. Dollar’s trajectory. The Greenback index (DX) is picking up steam since reaching a new record high for the last two years at 109.35, with its temporary pullbacks being limited by a 107.50 support area that previously served as a strong multi-month technical resistance.
In this context, the British Pound (GBPUSD) updated its lows since November 2023 to touch 1.2237 on January 9, EURUSD feels quite comfortable within a range between 1.02 and 1.0450, which corresponds to its 2-year bottom, and having a bias towards a possible further decline. The Aussie (AUDUSD) is one-step away from taking the path for a breakthrough to a quite unknown territory of its 5-year lows that were last time recorded when the initial outbreak of the Covid-19 happened.
A varying extent of the American Dollar strength is surely data dependent as the market community is eagerly waiting for the U.S. job data later today. The average expectations on new Nonfarm Payrolls is just a bit above 150,000 vs 227,000 in early December 2024 and nearly 160,000 for the previous four months on average. However, any value close to 150,000, plus or minus 20,000, or any higher number, may be considered as another positive sign for the Greenback, following the ADP national employment report which contained only 122,000 on Wednesday. The oppressive nature of average hourly wage in its dynamics, +0.4% each time from September to December, also matters.
The protective quality of investing more funds into the U.S. Dollar and U.S. bonds against tariff threats is switched on anyway, based on more than a 95% chance for the Fed to keep rates on pause at its January 29 meeting, according to CME's FedWatch tool. Federal Reserve officials never go against a well-established market consensus, when it is almost unanimous, for not to rock the boat of relative market trend stability. The central bankers' reluctance to shift the Fed fund rates lower before mid-March, if not early May, continues to play in favour of short-term speculative transactions on the foreign exchange market, bearing in mind all the listed currency instruments. Some intraday volatility may take place, especially in the case of appearing an abnormal two-digit non-farm value, but not a change in overall direction.
Merck & Co (MRK) stocks have shown signs of becoming a compelling buy opportunity. Over the past six months, the stock has been in a downtrend, declining 29.8% to $94.50 per share. However, since mid-November, MRK has demonstrated a reversal of momentum, rebounding by 10.0% to reach $104.87 on December 5. Following a brief pullback and consolidation period, the stock has retested the downtrend resistance and appears poised to continue its upward trajectory.
With prices currently positioned to target $110.00, this represents a potential 9-10% upside from the present levels. Setting a stop-loss at $93.50 aligns with a prudent risk management strategy, providing protection against further downside while allowing for upside potential. The recent consolidation phase further supports the case for a breakout, making this an attractive moment to consider initiating or adding to a position in MRK.
Here is the problem, which is nearly at a primary school level. A simple logical puzzle. A shopping street has two grocery stores. One of the stores is much more popular than the other. But both shops are full of customers every day. So both shops are raking in money. Sales output of a more popular store roughly doubled over the past year, from $14.5 billion to $30.8 billion - oh, yes, it's a very big shop - which led to tripling of its market value. Meanwhile, sales in the second store have already grown by 69%, albeit by its lower standards, namely from $2.3 billion to $3.9 billion. Please draw a conclusion, by what percentage the market value of the second store could increase, assuming that professional appraisers are rather objective. It seems ridiculous, but the correct answer is that the second store's market value lost 35% within the same year, and it even dropped by 50% from its peak price of the last spring. Holy Cow! That was a story of some failed expectations of mine. Since the big store is, of course, Nvidia, and the small one (and also, in fact, quite a prosperous marketplace) is Advanced Micro Devices (AMD). And their goods are not essential food, but chips for artificial intelligence (AI) related data centers, which are also in high demand.
Moreover, AMD shares reportedly tumbled 10% additionally on February 5, only because the firm's AI chip revenue failed to be exactly in line with elevated projections of Wall Street analyst pool, which somehow bet on a 80% pace of data centre growth to as much as $4.15 billion YoY. Okay, one might say that Nvidia's "store" sells 8 times more chips that everyone needs. And even remember that Nvidia chips are of better quality, that Nvidia occupies about 80% of global chip market share. Again, Nvidia's last quarter will be finally counted only by February 26, when Nvidia's financial report is scheduled, a month later than in AMD's case. Like most large investment houses, here I have provided growth metrics regarding the major data center segment, which is a proxy for the AI playground, where AMD struggles to compete with Nvidia. Well, AMD CEO Lisa Su admitted that her company's data center sales in the current quarter may go down about 7% from the just-ended quarter, but this announcement was exactly in line with an overall expected decline. Is it really such a big deal that AMD shareholders have to experience pain from seeing their chosen stock falling to a 14-month low, with further need for a 100% rally just to match last year's record prices?
The same Lisa Su declined to give the particular forecast for the company's AI chips, but she said that AMD expects "tens of billions" of dollars in sales "in the next couple of years". And I see no reason to doubt her words. AMD CEO added that the firm is now working to compete against Broadcom (AVGO) in collaborating with its customers like Meta and Microsoft to create custom AI chips for their purposes, as Broadcom helps its partners to design their own chips, contrary to mostly "off-the-shelf" processors by AMD and Nvidia. They know their weaknesses as opportunities for strengthening to work in that direction, so what's wrong with the market's adequacy of perception? Perfect Nvidia is the enemy of good AMD, according to the crowd's opinion. Besides AI chips, AMD is also one of the largest providers of personal computer chips. Until recently, this point was generally the source of their main income. Consumers continue to buy new PCs, which also can handle generative AI tasks, by the way.
Actually, AMD has been the only loss-making company in my large portfolio for a long time, so it even makes me smile now. At least, because it is only a matter of time before AMD's pogo stick ultimately uncoils to come loose. Record annual revenue and earnings have to entail recovering to record market value eventually. I am not sure this will happen in the first half of 2025, even though AMD forecasts its revenue rise between $6.8 billion and $7.4 billion for the current quarter, with the market consensus midpoint being slightly lower at $7.04 billion. If you don't believe me then analysts at Stifel are of the opinion that AMD is well positioned for AI compute and "It is likely" that some of its customers "are waiting for 325/350 systems, which should drive a much stronger second half". Again, the median estimate by the Wall Street's analyst pool was now declined to about $150 per share vs $166.5 before the last downside move, yet even $150 sounds much better compared to $112 on closing price this Wednesday or an intraday low at $106.56 during the last trading session. Anyway, there is a strong technical and psychological support zone near the round figure of $100, from where AMD stock had begun its cool ascension in late 2023.
VeChain (VET) has fallen 12.7% this week, trading at $0.0445, underperforming the broader cryptocurrency market. Bitcoin (BTC), the leading cryptocurrency, has declined by 5.6% to $93,220, with bearish momentum building as it approaches key support at $89,000-$91,000. This decline is largely attributed to tightening monetary conditions in the United States, which continue to weigh on risk assets. Investor confidence is further shaken by significant net outflows from spot BTC-ETFs, which lost $583 million on Wednesday, marking the second-largest single-day outflow on record.
If BTC falls below the critical support level of $89,000-$91,000, VeChain is likely to extend its losses, with prices potentially declining another 10% to $0.0400. A sustained drop in BTC could push VET even lower, towards $0.0300. Conversely, a strong rebound in BTC prices to the $100,000 level could drive VET back up to $0.0500, representing a recovery of approximately 12% from current levels.
Amazon stocks have surged by 170% over the last five years. In the beginning, Amazon was just a marketplace, but now it has a very diverse business ranging from a streaming service, Amazon Prime Video, to Cloud Amazon Web Services (AWS). Moreover, it would be absolutely wrong to only consider Amazon as a marketplace. The AWS segment of the company alone may count for over $1.4 trillion, which is currently the overall Amazon market cap.
AMZN stocks have lost 25% since the beginning of 2022 due to the disruption of supply chains and a very strong U.S. Dollar. Q2 2022 revenues of Amazon only rose by 7% year-on-year to $121.2 billion, while operating income dropped by 57% year-on-year to $3.3 billion. Over the last 12 months the company has increased its capital spending and, therefore, its net cash flow has gone down from $4.2 billion to -$26.1 billion.
AWS net sales jumped by 33% year-on-year to $19.7 billion in the Q2 2022, while sector operational income rose by 36% year-on-year to $5.7 billion. The net margin of Amazon.com is close to 10% amid a widening cooperation with third-party sellers, but the AWS net margin has already jumped to 30% and may grow to 40% soon. Cloud segment revenues not only compensated for the slowdown of retail sales, but allowed for the invest in new segments like Zoox autonomous vehicles.
The dividends of the Walmart, one of the world’s largest retail corporation with a huge chain of hypermarkets, are growing for the last 49 years. The company develops its own e-commerce segment to resist the pressure from on-line retail market players. This development is suggested to be a key driver for Walmart’s growing business. Walmart+ clients would also be granted an access to Paramount+ streaming service.
Walmart Q2 2022 net sales rose by 8.2% year-on-year. On-line sales were up by 12%, which is a pretty good result given the last-year COVID-19 restrictions that boosted on-line sales in 2021. The company has spent $3.1 billion on dividends and $5.7 billion on buybacks in the first half of 2022.
Walmart stocks are considered a safe haven asset. The demand for company’s services is intact despite negative economic developments, prompting investors’ interest. WMT stock prices are 6% down from the beginning of 2022.
Johnson & Johnson was founded in 1886, and since the last 60 years is constantly raising its dividends. The company has a truly diversified business with three major segments: Consumer health, Pharmaceutical, Medical Devices.
The recent Q2 2022 earnings report was impressive despite consumer market tightening. The revenue grew by 3% year-on-year to $24 billion, while the net free cash flows rose to $8.1 billion over the first half of 2022. Dividend and buybacks were at $5.8 billion and at $2.6 billion respectively. Consumer health segment rose by 3% year-on-year amid elevated demand for analgesics and upper airways medicine. Skin Care Neutrogena brand significantly contributed to the segment earnings. Pharmaceutical sales were up by 12% year-on-year mainly on rising cancer treatment medicine, Grohn’s disease drugs, precox treatment and some other diseases. The COVID-19 vaccine is not expected to make a significant contribution to the segment. Medical Devices segment was up by 3% year-on-year on elevated demand for surgical systems and electrophysiology equipment. Diversified business and vas cash flows are magnetizing investors worldwide, especially now as JNJ stock prices are 7% below the beginning of 2022.
Procter & Gamble is constantly increasing its dividends for the last 66 years, which is an astonishing record even among famous U.S. corporations that are operating across the globe. The company has a 200 year track record. Investments in such sustainable reputable companies like Procter & Gamble are looking logical in a turmoil periods.
PG share prices declined by 13% from the beginning of 2022 compared to 16% drop of S&P 500 broad market index. Nobody doubt the company’s shares will recover, as prices dropped only in a connection of the market sentiment, but a not financials of the company itself. Despite stronger U.S. Dollar and rising energy prices net sales of PG rose by 5% to $80.2 billion in 2022. The company spent $10 billion on the buyback and $8.8 billion ion dividends in 2021.
Management of the company provides an optimistic forward guidance for the 2023 with 3-4% growth of sales and EPS up by 4%. Buyback program would be continued with $ 6-8 billion reserved for it while dividend payouts would be raised to $9 billion. Such guidance together with a discount share prices by 14% create excellent buy opportunities for investors.
Join our community
Share your professional and amateur observations, exchange experiences, anticipate developments